Difference between revisions of "How To Use Monitoring Agents"
(New page: Most monitoring agents will need to be declared as arguments to the JVM. In order to do that, dimply edit the ''startofbiz.sh'' (or .bat on windows) script and replace the following: V...) |
|||
| (8 intermediate revisions by 2 users not shown) | |||
| Line 9: | Line 9: | ||
VMARGS="$MEMIF $MISC $DEBUG $RMIIF $ADMIN $MONITORING" | VMARGS="$MEMIF $MISC $DEBUG $RMIIF $ADMIN $MONITORING" | ||
| + | === New Relic RPM === | ||
| − | + | [[Image:Newrelic.png|thumb|400px]] | |
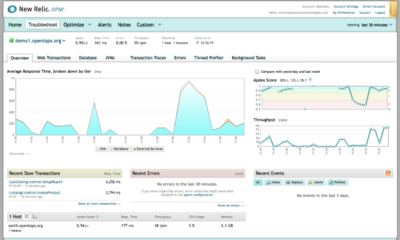
| − | + | [https://rpm.newrelic.com/signup/?product%5Blevel%5D=Lite&product%5Bcommitment%5D=Monthly&subscription%5Bnumber_of_hosts%5D=1&partnership_id=85&promo_code=OT30PRO New Relic RPM] is a web-based service which helps you monitor, diagnose, and fix application performance problems in real time. Statistics about your application are uploaded to the New Relic server, which gives you information about response times, database queries, and Web transactions. The basic monitoring service is free, and additional services can help you troubleshoot and optimize your application. | |
| − | MONITORING="- | + | First download the zip file containing the jar and download the YML file (available on the same page). Unzip the zip file and put the YML file in the same directory. |
| + | |||
| + | Then edit your <tt>startofbiz.sh</tt> or <tt>startofbiz.bat</tt> and add | ||
| + | |||
| + | MONITORING="-javaagent:/full/path/to/newrelic.jar" | ||
| + | |||
| + | '''NOTE''': this needs to be the full path, like <tt>/home/me/opentaps/newrelic/newrelic.jar</tt>, not just the relative path from your opentaps directory. | ||
| + | |||
| + | Next change <tt>VMARGS</tt> to | ||
| + | |||
| + | VMARGS="$MEMIF $MISC $DEBUG $RMIIF $ADMIN $MONITORING" | ||
| − | + | Finally start Opentaps with the ''startofbiz.sh'' and you should start receiving data on their dashboard. | |
| − | + | '''You can get a free month of New Relic RPM Gold with promotion code OPENT210ZHL'''. | |
| − | + | === JConsole === | |
| − | + | See http://java.sun.com/developer/technicalArticles/J2SE/jconsole.html | |
| − | MONITORING="- | + | MONITORING="-Dcom.sun.management.jmxremote" |
| − | Then start Opentaps with the ''startofbiz.sh'' and | + | Then start Opentaps with the ''startofbiz.sh'' script and use ''JDK_HOME/bin/jconsole'' to connect to the opentaps JVM and start monitoring. |
Latest revision as of 18:55, 28 March 2012
Most monitoring agents will need to be declared as arguments to the JVM. In order to do that, dimply edit the startofbiz.sh (or .bat on windows) script and replace the following:
VMARGS="$MEMIF $MISC $DEBUG $RMIIF $ADMIN"
By:
  MONITORING="the agent parameters"
  VMARGS="$MEMIF $MISC $DEBUG $RMIIF $ADMIN $MONITORING"
New Relic RPM
New Relic RPM is a web-based service which helps you monitor, diagnose, and fix application performance problems in real time. Statistics about your application are uploaded to the New Relic server, which gives you information about response times, database queries, and Web transactions. The basic monitoring service is free, and additional services can help you troubleshoot and optimize your application.
First download the zip file containing the jar and download the YML file (available on the same page). Unzip the zip file and put the YML file in the same directory.
Then edit your startofbiz.sh or startofbiz.bat and add
MONITORING="-javaagent:/full/path/to/newrelic.jar"
NOTE: this needs to be the full path, like /home/me/opentaps/newrelic/newrelic.jar, not just the relative path from your opentaps directory.
Next change VMARGS to
VMARGS="$MEMIF $MISC $DEBUG $RMIIF $ADMIN $MONITORING"
Finally start Opentaps with the startofbiz.sh and you should start receiving data on their dashboard.
You can get a free month of New Relic RPM Gold with promotion code OPENT210ZHL.
JConsole
See http://java.sun.com/developer/technicalArticles/J2SE/jconsole.html
MONITORING="-Dcom.sun.management.jmxremote"
Then start Opentaps with the startofbiz.sh script and use JDK_HOME/bin/jconsole to connect to the opentaps JVM and start monitoring.
